


Key Takeaways
- Influenza-associated hospitalizations are higher in late September 2026 than they were at the same time in the prior six flu seasons.
- During the week beginning September 21, 2026, the rate of influenza-associated hospitalizations was nearly 3-fold higher than the next-highest rate observed at the same point in the prior six seasons, reaching 3.5 hospitalizations per 1,000 hospitalizations.
- Influenza-associated hospitalizations rose rapidly from August 31 through the week beginning September 21, 2026, increasing at a rate more than 2.5 times faster than any of the six prior seasons over the same period.
Introduction
Influenza, commonly known as the flu, is a contagious respiratory disease that can spread from person to person through respiratory droplets. Symptoms can include fever or chills, cough, sore throat, congestion, body aches, and fatigue (1). Influenza activity typically increases during the fall and winter, but the timing and pace of each flu season can vary (2). While many influenza infections can be mild, some cases progress to severe illness requiring hospitalization (1). Monitoring hospitalization patterns can provide an early view of how influenza activity is changing and place the current season in context with recent years.
Timely real-world data is essential to understand how influenza activity is evolving while the season is underway. Comparing activity at the same point across multiple seasons helps determine whether increases in hospitalizations are consistent with historical patterns or indicative of a more severe season.
In this analysis, we used Truveta Data to compare influenza-associated hospitalizations in early 2026-27 season with those in recent seasons.
Methods
We used a subset of Truveta Data to compare weekly influenza-associated hospitalizations across the 2020–21 through 2026–27 influenza seasons. Hospitalizations were grouped into Monday–Sunday calendar weeks. This study included data through September 26, 2026.
Influenza-associated hospitalizations were defined as hospitalizations in which a patient had a positive influenza laboratory test from 14 days before the hospital admission through discharge, or a positive test directly associated with the hospitalization encounter. Because this definition is based on the timing of a positive influenza test relative to a hospitalization, influenza may not have been the primary reason for the hospitalization.
Influenza-associated hospitalization rates were calculated as the number of influenza-associated hospitalizations per 1,000 hospitalizations. In the United States, influenza activity typically increases during the fall and winter, with October through May (3) highlighted in the figure to provide seasonal context. Because the 2026–27 season is still underway, we compared the latest available weekly observation, the week beginning September 21, 2026, with the corresponding point in each of the six previous seasons.
We also evaluated how quickly influenza-associated hospitalization rates were changing. For each season, we calculated the average weekly change in the hospitalization rate over the prior four-week period. For the 2026–27 season, this period spanned the weeks beginning August 31 through September 21, 2026.
Results
During the week beginning September 21, 2026, the rate of influenza-associated hospitalizations was 3.5 per 1,000 hospitalizations. This season, the rate of hospitalizations is nearly 3 times as high as the next-highest rate observed at the comparable point in the prior six seasons (1.2 per 1,000 which occurred in 2022–23).
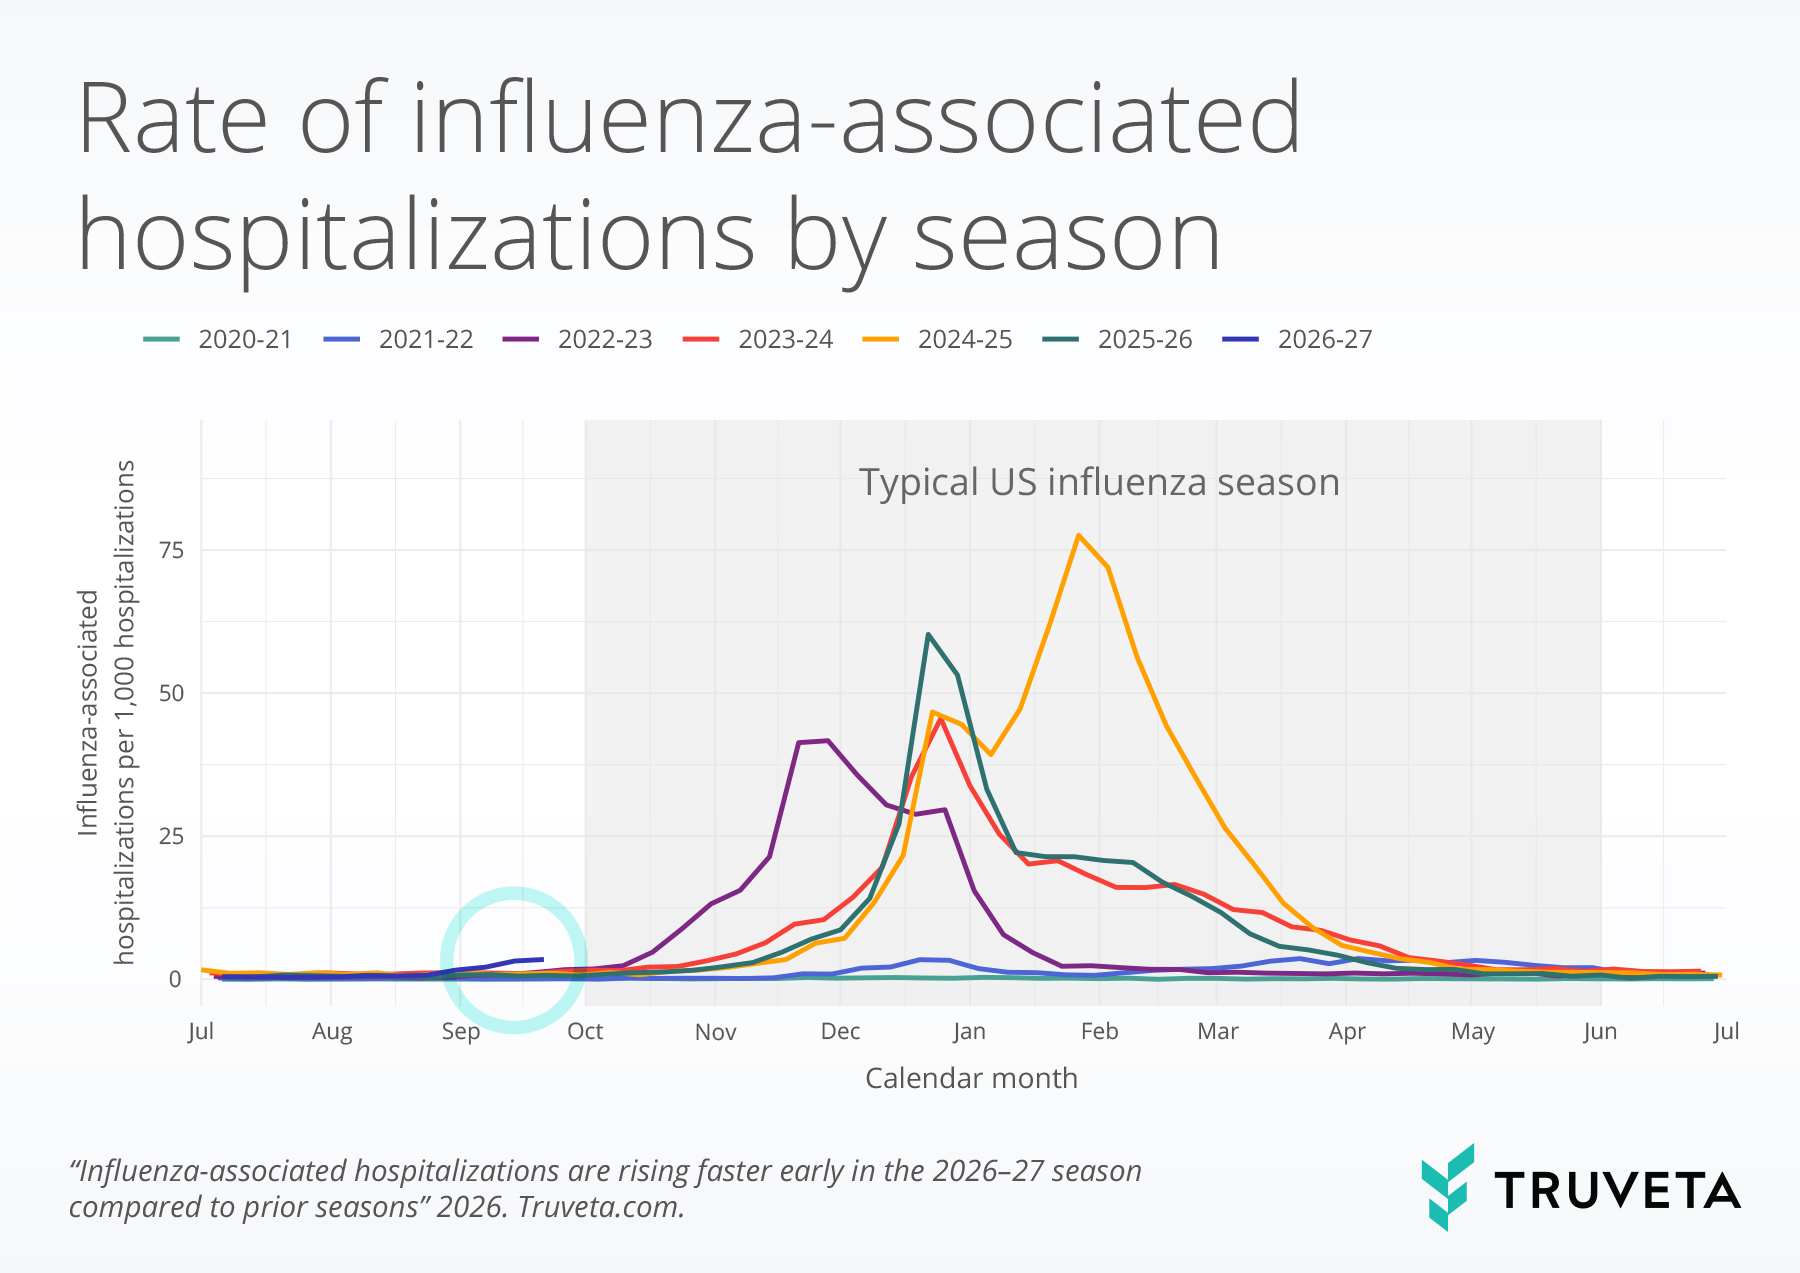
Across the four weeks prior to September 21, 2026, the influenza-associated hospitalization rate increased by an average of 0.7 hospitalizations per 1,000 hospitalizations each week. This was more than 2.5 times as fast as the next-fastest increase observed at the comparable point in the prior six seasons, which was 0.3 per 1,000 hospitalizations per week in 2022–23. Across the prior six seasons, the median weekly change was −0.03 hospitalizations per 1,000 hospitalizations per week, indicating that the rate of hospitalizations were generally stable or declining at this point in the season.
Discussion
In this early comparison of influenza seasons, we found that influenza-associated hospitalizations were higher and rising more rapidly in the 2026–27 season than at the comparable point in the six previous seasons. These findings are consistent with national influenza surveillance data from CDC FluView over the same period. For the week ending September 26, 2026, test positivity, an early indicator of influenza circulation, increased (4). Both these data and the data presented in this report highlight the early stages of an increase in influenza transmission.
Influenza follows a strong seasonal pattern, although the factors that shape the timing and magnitude of influenza activity are complex (5). Staying up to date on annual influenza vaccination remains important for reducing the risk of severe influenza and hospitalization (6,7). Vaccination also helps protect the broader community by reducing influenza transmission, providing additional protection for people who may be particularly vulnerable to severe illness (6,7).
Importantly, early influenza activity does not necessarily predict how the remainder of the season will unfold. The timing, magnitude, and duration of influenza activity can vary from season to season (5). Although influenza-associated hospitalizations are currently higher and increasing faster than at the same point in recent seasons, these findings should not be interpreted as a prediction of the eventual severity or peak of the 2026–27 season. Continued monitoring will be important as the season unfolds.
This analysis has some limitations. Influenza-associated hospitalizations were identified based on a positive influenza test occurring within the specified time window around the hospitalization and may include patients who were hospitalized for reasons other than influenza. In addition, because this analysis focuses on hospitalized patients, these findings should not be interpreted as a measure of influenza infection or illness in the broader population.
These are preliminary research findings and have not been peer reviewed. Truveta Data are continuously updated as new information becomes available. These findings reflect data accessed on October 5, 2026.
Citations
Centers for Disease Control and Prevention, “Signs and Symptoms of Flu” (2024); https://www.cdc.gov/flu/signs-symptoms/index.html (accessed 5 October 2026).
Li, Y., Reeves, R. M., Wang, X., et al., Lancet Glob. Health 7, e1031–e1045 (2019).
Centers for Disease Control and Prevention, “Chapter 6: Influenza,” Manual for the Surveillance of Vaccine-Preventable Diseases (2024).
Centers for Disease Control and Prevention, “Weekly US Influenza Surveillance Report: Key Updates for Week 38, ending September 26, 2026,” FluView (2 October 2026).
E. Lofgren, N. H. Fefferman, Y. N. Naumov, J. Gorski, E. N. Naumova, J. Virol. 81, 5429–5436 (2007).
American Academy of Pediatrics Committee on Infectious Diseases, Pediatrics (2026), doi:10.1542/peds.2026-078778.
K. B. O’Reilly, “Flu, COVID-19, RSV immunizations: What to know this respiratory virus season,” American Medical Association (2 October 2026).