Unlocking health insights with compreshensive EHR data
Truveta Data is the most complete, timely, and clean regulatory-grade EHR data
Regulatory-grade EHR data for more than 100 million patients, linked with SDOH, mortality, and claims data for a complete view into the patient journey.
patients and growing
clinical notes
unique medical devices
years patient history
SDOH attributes
Trusted by leading life science, government, and healthcare organizations


Truveta solutions
Safety
Fulfill post-market regulatory requirements and assess long-term product safety more efficiently with real-time data.
Comparing the safety of novel interventions
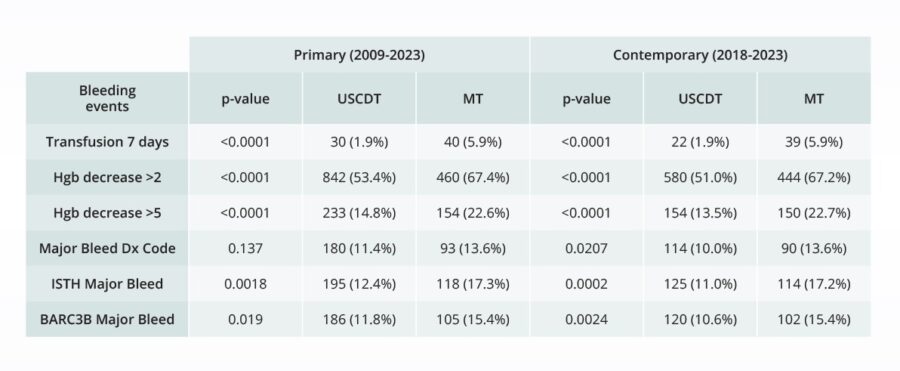 Comparative bleeding incidence 7 days post-procedure for pulmonary embolism interventions
HEOR
Comparing real-world treatment outcomes
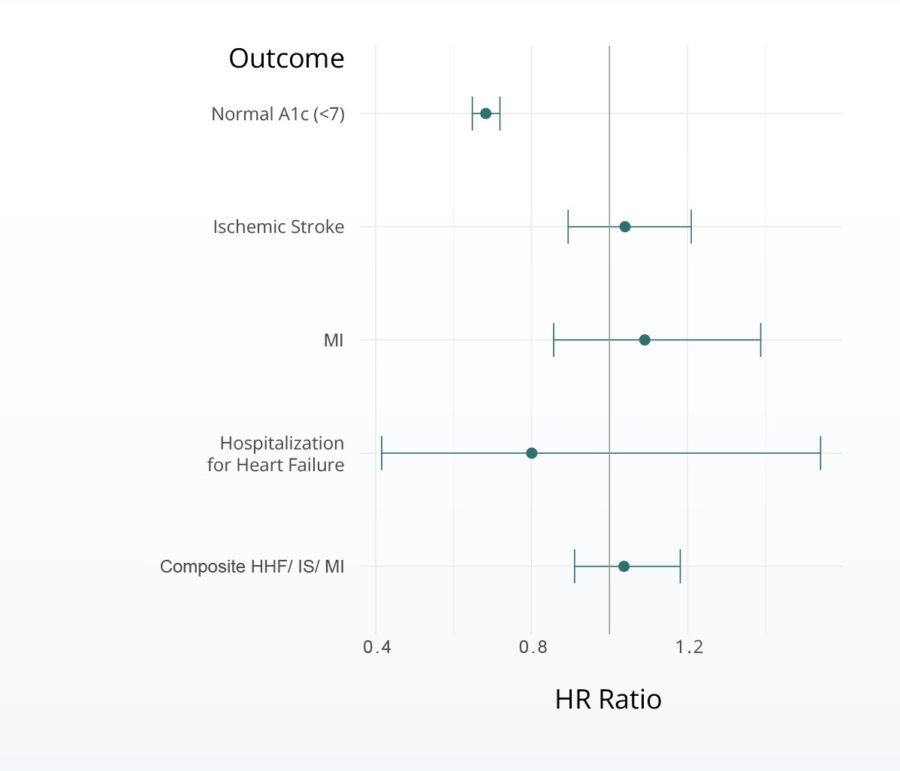
Hazard of cardiovascular events associated with SGLT2i vs metformin
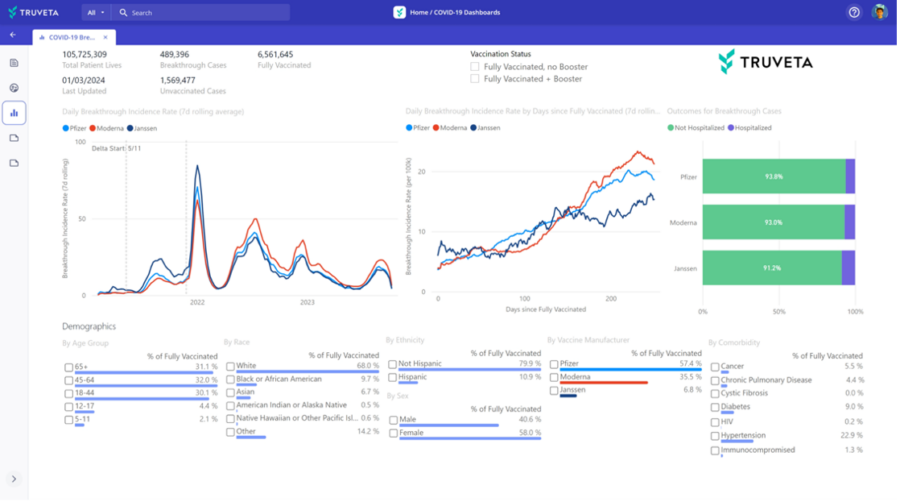
Public health
Respiratory virus-associated hospitalizations (from monitoring report)
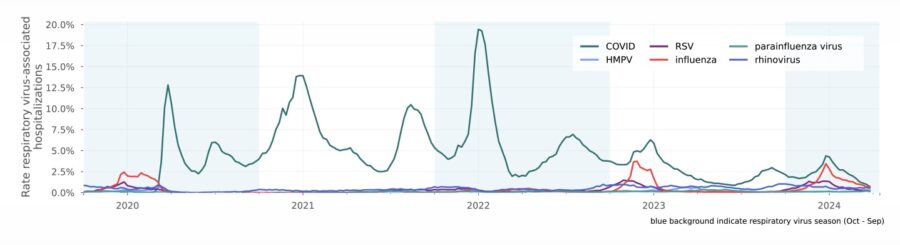
Rate of weekly respiratory virus-associated hospitalizations compared to all hospitalizations since October 2019
Clinicial trials
Validate trial design and supplement trial data with real-world control arms.
Testing I/E criteria to de-risk clinical programs
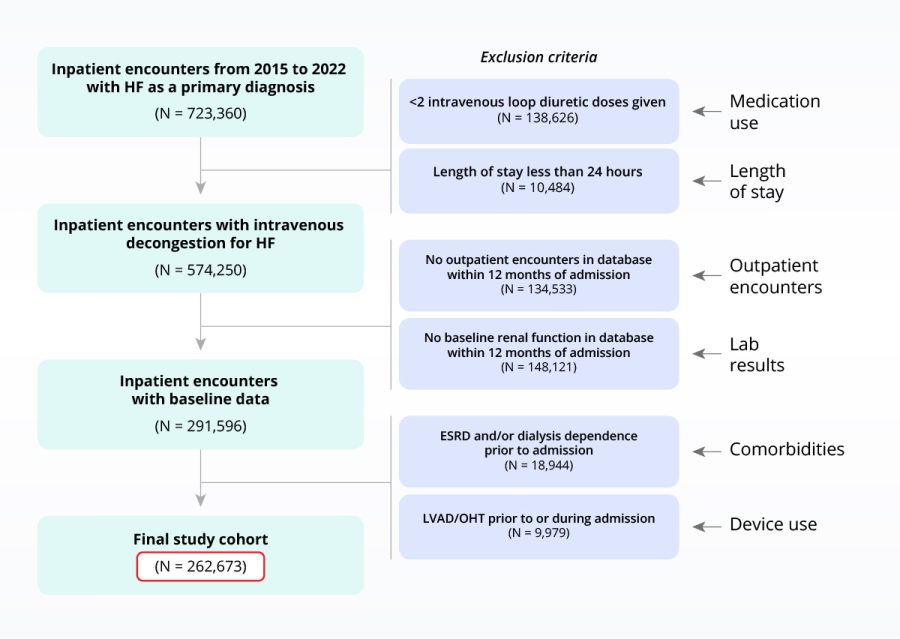
Sample heart failure population with inclusion/exclusion criteria applied
Care quality
Track patient outcomes and benchmark to real-time, nationally representative EHR.
Tracking procedure utilization and outcomes over time
Real-time dashboard showing TAVR volumes, access by cohort, and adverse events
Market access
Monitor and ensure patient access to therapies using real-time EHR data.
Assessing the impact of drug shortages
Rate of amphetamine/dextroamphetamine prescription fills per eligible population, stratified by age
Research and development
Train AI models for discovery and product enhancement with complete and representative EHR data.
Exploring the association between heart failure and medication use
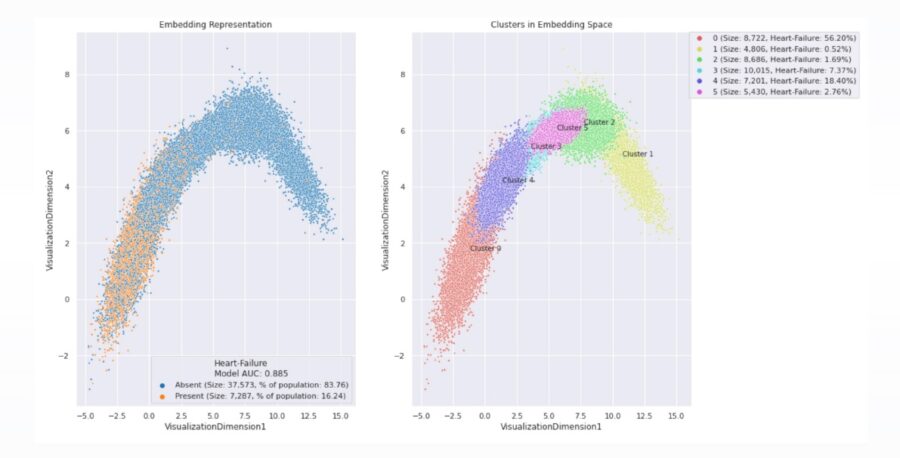
Population clustering to facilitate drug discovery
Truveta solutions

Safety
HEOR
Public health
Clinical trials
Care quality
Market access
Research & development
Safety
Fulfill post-market regulatory requirements and assess long-term product safety more efficiently with real-time data.

Comparative bleeding incidence 7 days post-procedure for pulmonary embolism interventions
HEOR
Evaluate clinical- and cost-effectiveness to differentiate products using real-world data from 30 health systems.

Hazard of cardiovascular events associated with SGLT2i vs metformin
Public health
Monitor disease trends, assess drug and device uptake, and identify disparities in healthcare access and outcomes with EHR data linked to SDOH and claims data.

Rate of weekly respiratory virus-associated hospitalizations compared to all hospitalizations since October 2019
Clinical trials
Validate trial design and supplement trial data with real-world arms.

Care quality
Track patient outcomes and benchmark to real-time, nationally representative EHR data.
Tracking procedure utilization and outcomes over time

Real-time dashboard showing TAVR volumes, access by cohort, and adverse events
Market access
Monitor and ensure patient access to therapies using real-time EHR data.
Assessing the impact of drug shortages

Rate of amphetamine/dextroamphetamine prescription fills per eligible population, stratified by age
Research and development
Train AI models for discovery and product enhancement with complete and representative EHR data.
Exploring the association between heart failure and medication use

Population clustering to facilitate drug discovery
See the power of the Truveta EHR Data in action
Case study

Comparing the safety of novel pulmonary embolism devices
Real-world data plays a crucial role in filling knowledge gaps on drugs and devices. To understand the real-world safety of its EKOS device in comparison to Inari Medical’s FlowTriever for treatment of pulmonary embolism, Boston Scientific turned to a team of independent researchers to compare the risk of major bleeding events for the two devices, using Truveta Data.