



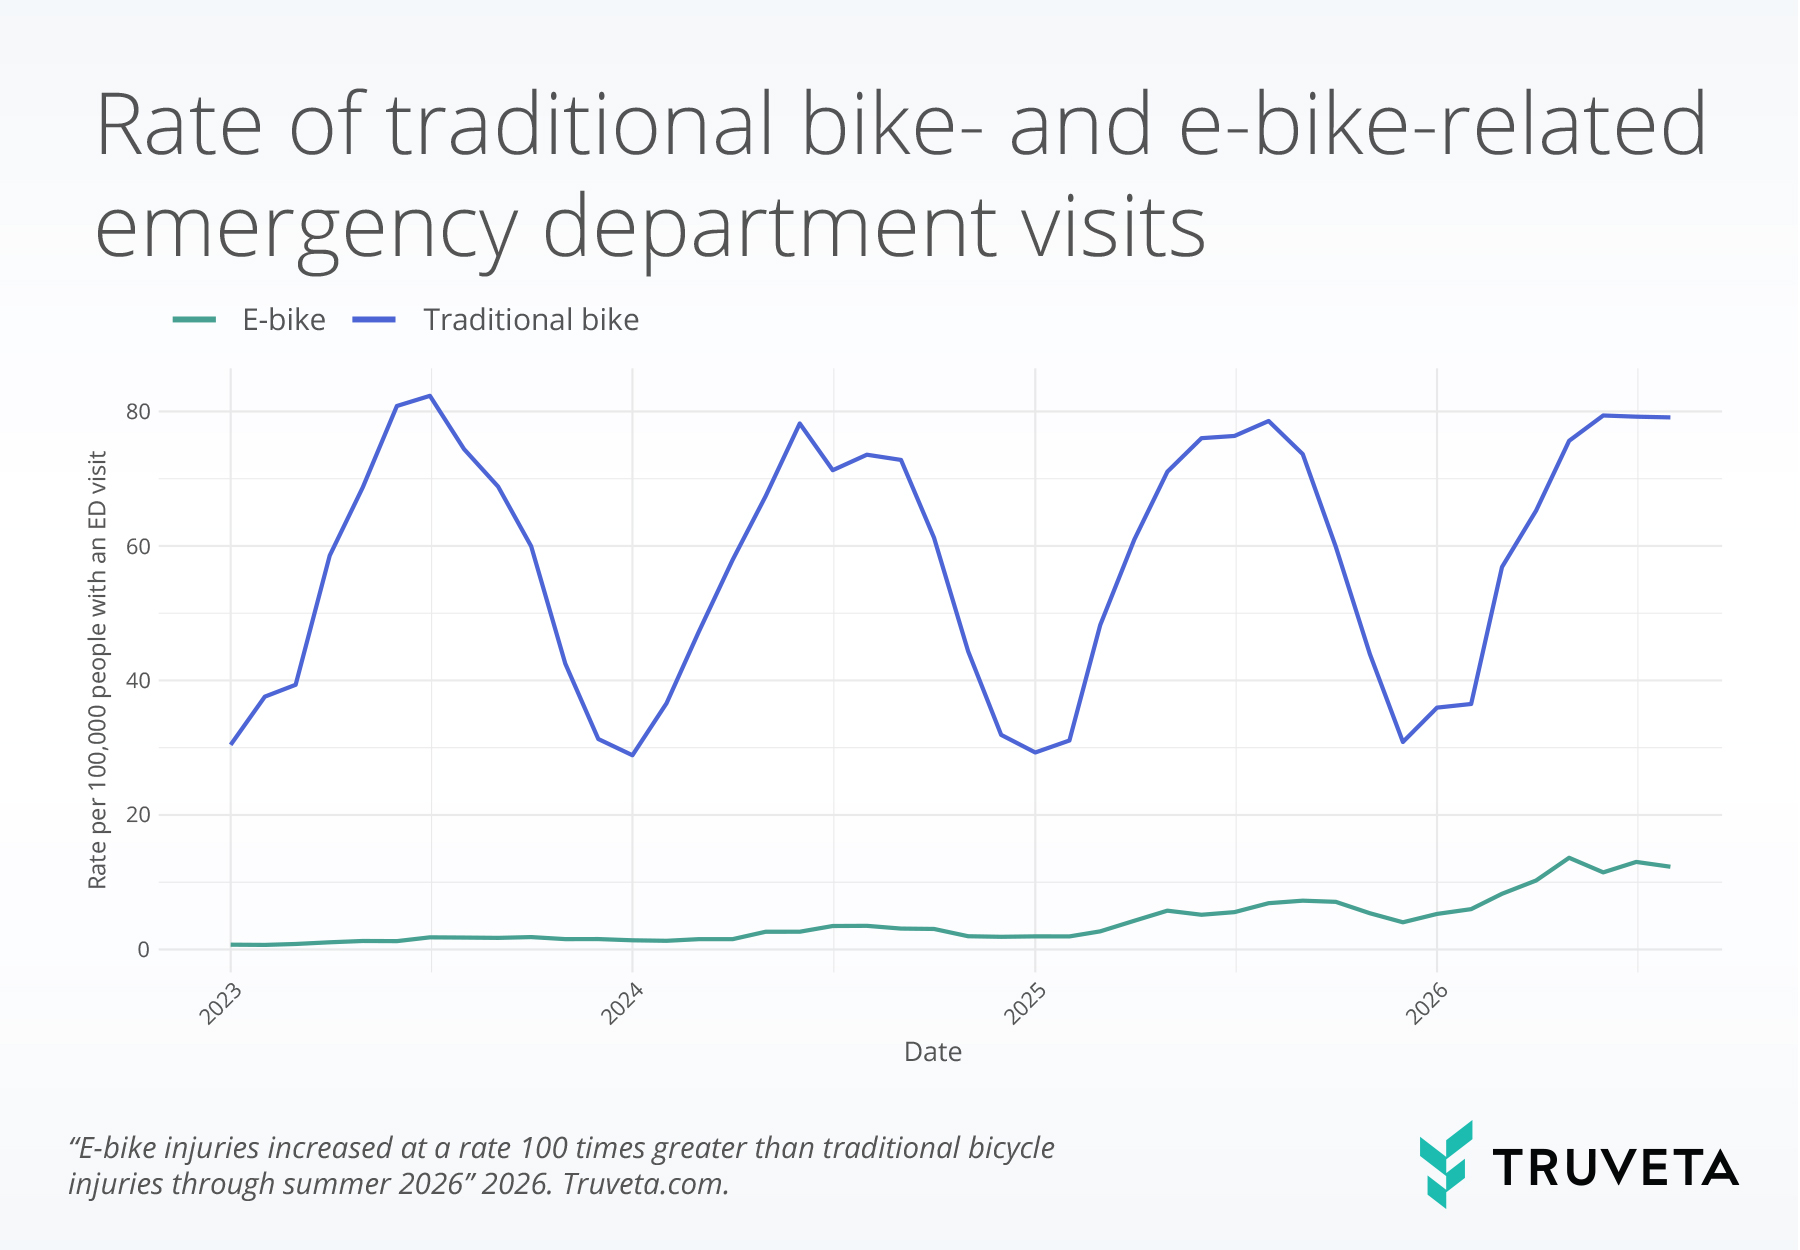
- Although traditional bicycle-related ED visits remained far more common, e-bike injury rates increased 760.2% between 2023 and August 2026, while traditional bicycle injuries remained relatively stable, increasing only 7.9%.
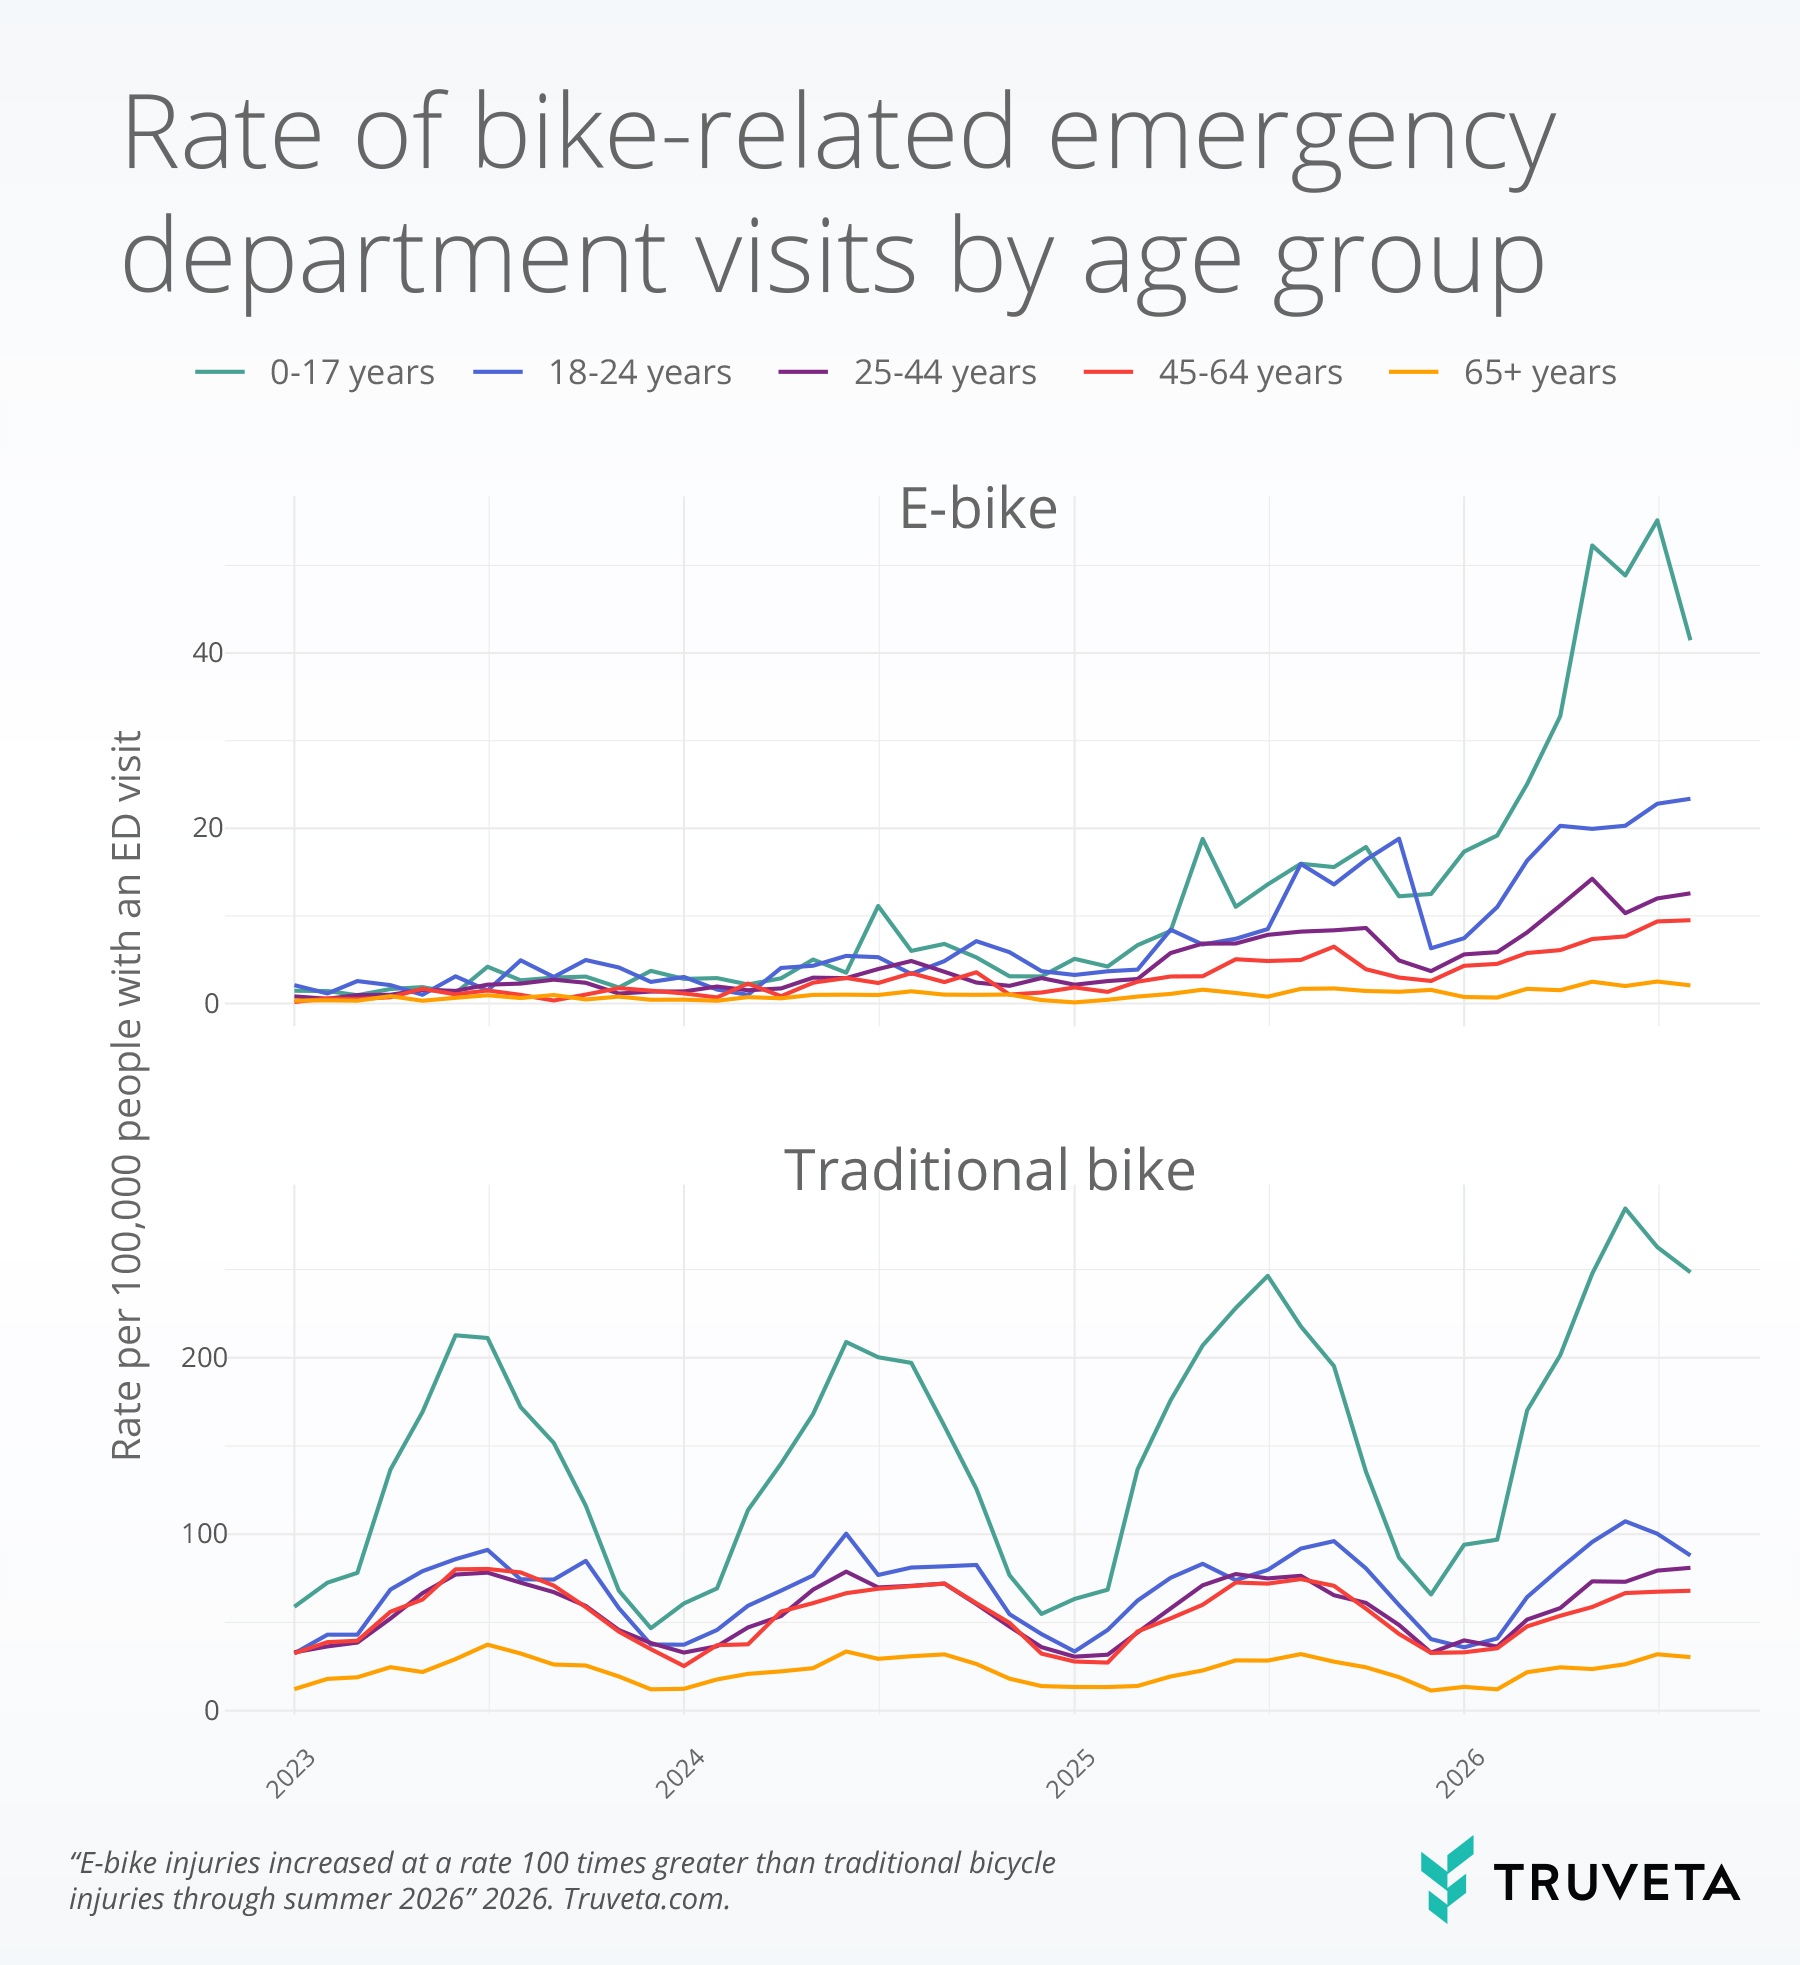
- Among children and adolescents, the e-bike-related ED visit rate increased 19.1-fold, compared with a 1.5-fold increase for traditional bicycles.
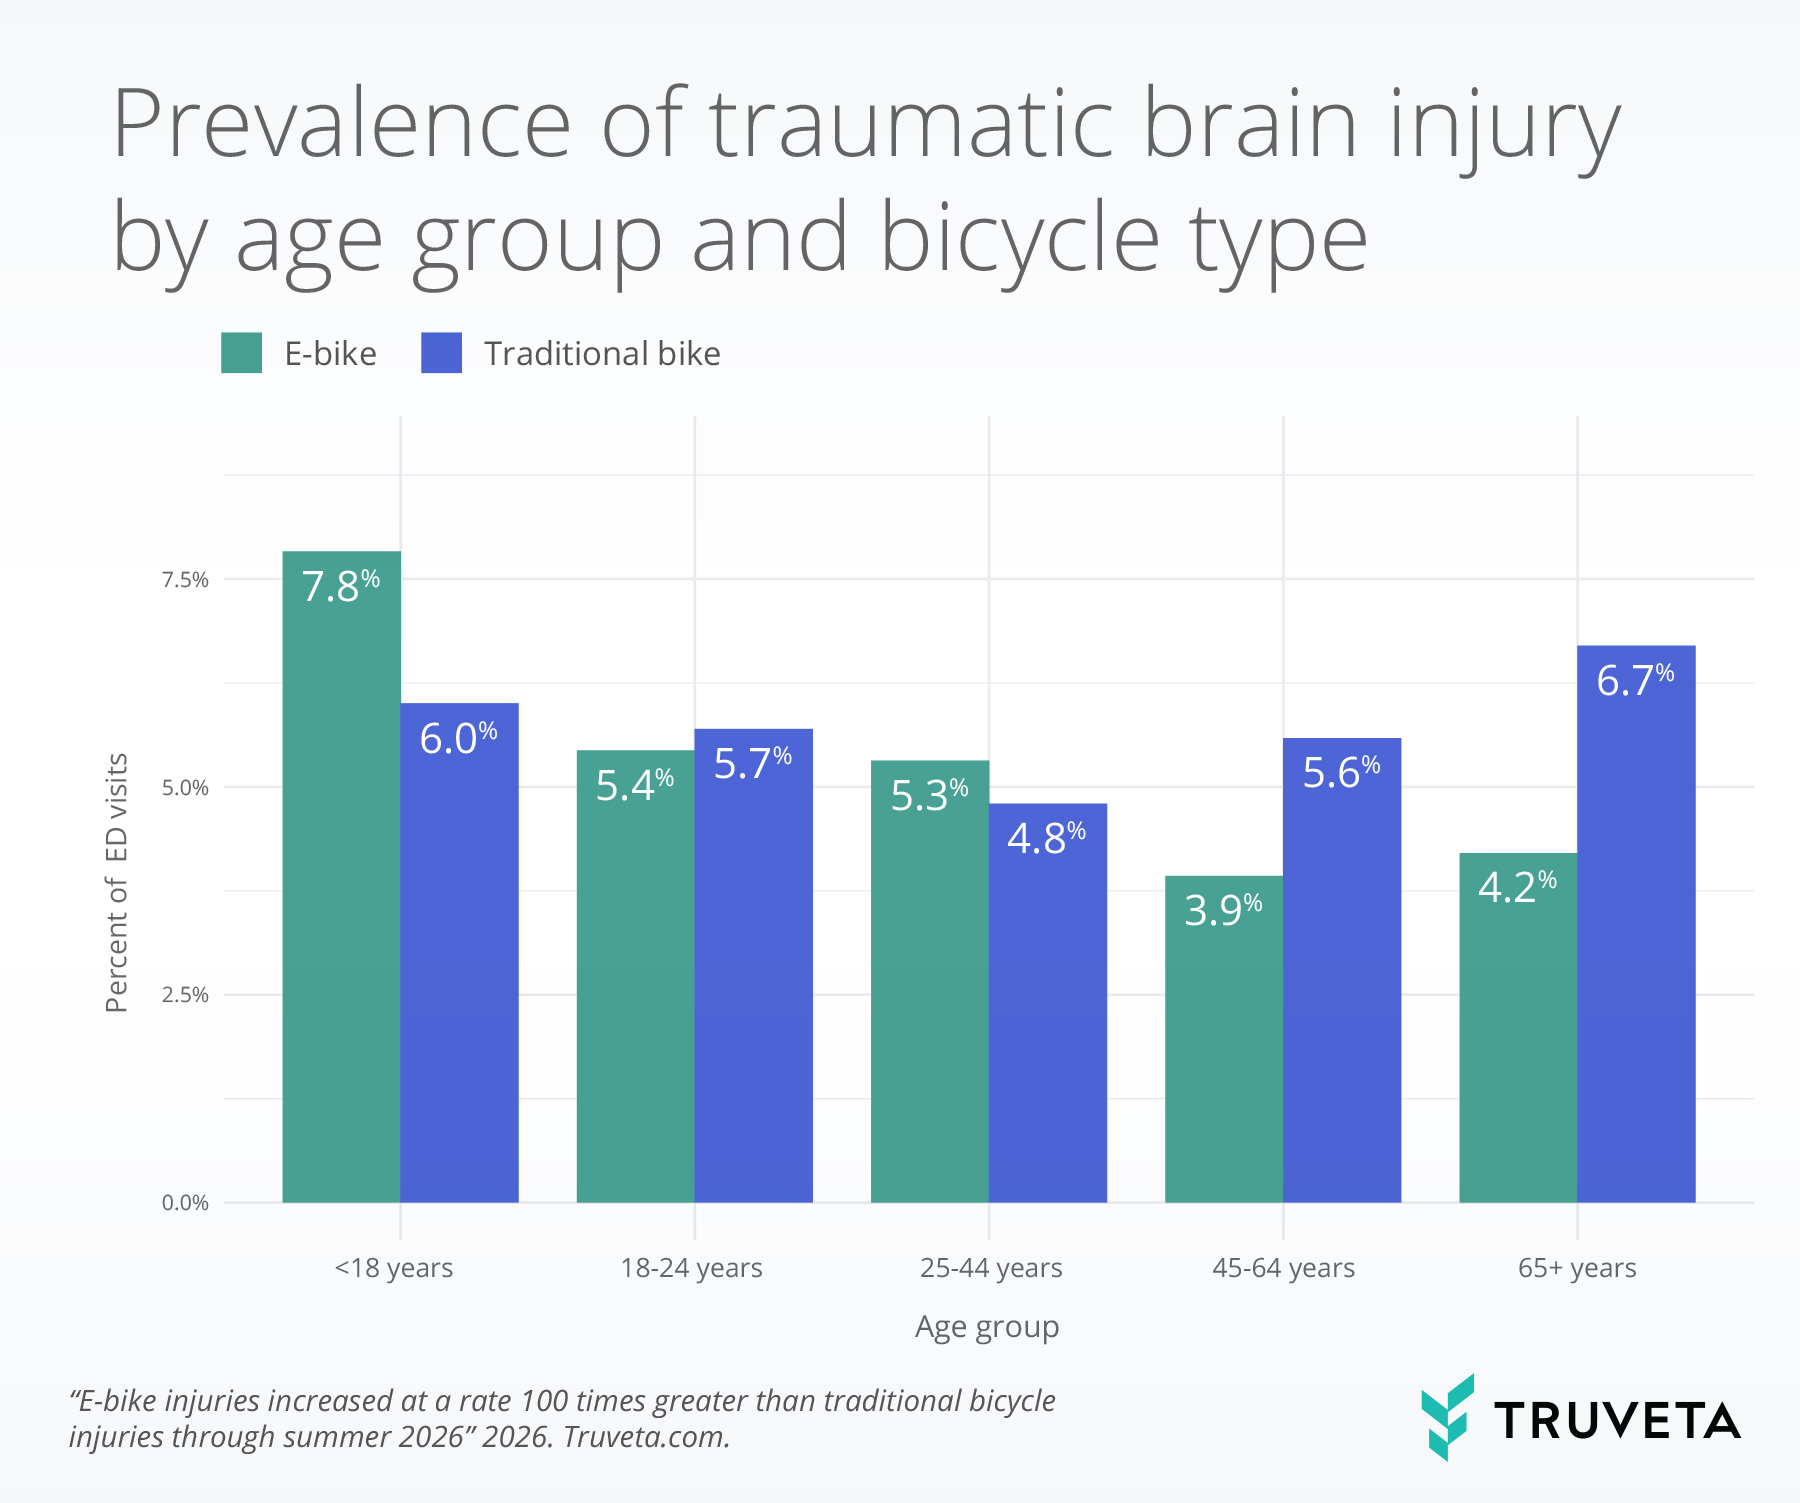
- Traumatic brain injury was diagnosed in 7.8% of e-bike-related ED visits among patients younger than 18 years, compared with 6.0% of traditional bicycle ED visits.
In our recent analysis of e-bike- and e-scooter-related emergency department (ED) visits, we found a 7.5-fold increase in the rate of visits among children and adolescents over the past 3 years. As a follow-up, we wondered how e-bike-related emergency department visits compared with traditional bicycle-related visits, especially in summer months.
Comparing e-bikes with traditional bicycles provides important context for these trends. E-bikes can travel faster than traditional bicycles, and research indicates e-bike owners rode longer distances and took more trips per week than traditional bike owners (3–6). Collision data also found that e-bike collisions more often involved unsafe speeds and improper turning violations compared to traditional bike collisions (3, 6).
While recent national research found that e-bike injury-related ED visits increased much faster than traditional bicycle visits through 2024 (1, 2), more recent data are limited. Although e-bike injury patterns are generally similar to those associated with traditional bicycles, several studies have found that e-bike crashes are more likely to result in severe outcomes, including head and facial injuries, traumatic brain injuries, and critical trauma or intensive care treatment (3–6).
Notably, helmet use among injured e-bike riders has been reported in only about 31% of cases, and varied by age (7). However, findings have not been entirely consistent, and much of the comparative research used data prior to the recent spike in e-bike injuries among children and adolescents (3, 6).
Using a subset of Truveta Data, we examined e-bike- and traditional bicycle-related ED visits over time and across age groups, then compared patient characteristics, injured body regions, injury types, and rate of traumatic brain injuries.
Methods
We used a subset of Truveta Data to identify ED visits with diagnosis codes indicating involving an e-bike or a traditional bicycle from January 2023 through August 2026. ED visits were required to be at least 30 days apart to increase confidence that the visits were for different bike injuries.
We calculated monthly rates of individuals with an ED visit related to an e-bike or traditional bike injury visit per 100,000 people with an ED visit. We stratified results by age group (0–17, 18–24, 25–44, 45–64, and 65 years or older). Because the study period included data only through August 2026, we compared only the January–August period across years to account for seasonal changes in e-bike and e-scooter use.
To characterize injuries, we evaluated all injury diagnoses recorded on the same day as the bike injury ED visit. Injury diagnoses were categorized using the National Center for Health Statistics ICD-10-CM Injury Diagnosis Matrix, which classifies injuries according to both body region and injury type.
Body regions were grouped into the following categories:
- Head and neck
- Shoulder and upper arm
- Forearm and elbow
- Wrist, hand, and fingers
- Trunk
- Hip, upper leg, and thigh
- Knee
- Lower leg and ankle
- Foot and toes
Injury types were categorized as:
- Superficial injuries and contusions
- Fractures
- Open wounds
- Sprains and strains
- Traumatic brain injuries (including concussions)
- Dislocations
- Internal organ injuries
- Other injuries
As patients can receive multiple injuries during a single event, individuals could contribute to multiple injury categories and types.
Results
Traditional bicycle-related ED visits were far more common than e-bike-related ED visits during the study period, with 63,811 traditional bicycle-related ED visits compared with 4,769 e-bike-related ED visits. Nearly 1 in 3 e-bike (31.1%) and traditional bicycle (29.3%) injuries occurred in patients under 18 years of age. Adults aged 18–24 years represented a larger share of e-bike visits than traditional bicycle visits (15.0% vs. 9.8%), whereas adults aged 65 years or older represented a smaller share (7.0% vs. 11.3%). 75.9% of e-bike patients and 76.3% of traditional bicycle patients were male.
E-bike and traditional bicycle-related ED visit rates
The rate of e-bike-related ED visits increased from 1.2 per 100,000 people with an ED visit in January–August 2023 to 10.1 per 100,000 in January–August 2026, representing a 760.2% increase. The traditional bicycle rate remained stable, increasing only 7.9%, from 59.4 to 64.1 per 100,000 over the same period.
E-bike and traditional bike-related ED visit rates by age group
Across the study period, bicycle-related ED visit rates were highest among younger age groups for both e-bikes and traditional bicycles. Overall, rates of e-bike-related ED visits were highest among patients aged 0-17 years (11.4 per 100,000 people with an ED visit) and 18-24 years (7.9 per 100,000), while rates declined with increasing age. A similar pattern was observed for traditional bicycle-related ED visits, with the highest rates among patients aged 0-17 years (143.3 per 100,000) followed by those aged 18-24 years (69.0 per 100,000).
E-bike-related ED visit rates increased across every age group. The largest relative increase occurred among patients aged 0–17 years; the rate increased from 1.9 per 100,000 people with an ED visit in January–August 2023 to 35.7 per 100,000 in January–August 2026, representing a 19.1 fold increase. Rates also increased among adults aged 18–24 years (7.7 fold), 25–44 years (7.4 fold) 45–64 years (7.6 fold), and 65 years or older (3.2 fold).
Similar to the overall rate, traditional bicycle-related ED visit rates for each age group changed less over the study period. From January-August 2023 to January-August 2026, rates increased 1.45-fold among patients aged 0-17 years, 1.19-fold among adults aged 18-24 years, and 1.09-fold among adults aged 25-44 years. Rates among adults aged 45-64 years and 65 years or older were 0.92-fold and 0.95-fold of their January-August 2023 levels, respectively.
Injuries associated with e-bikes and traditional bicycles
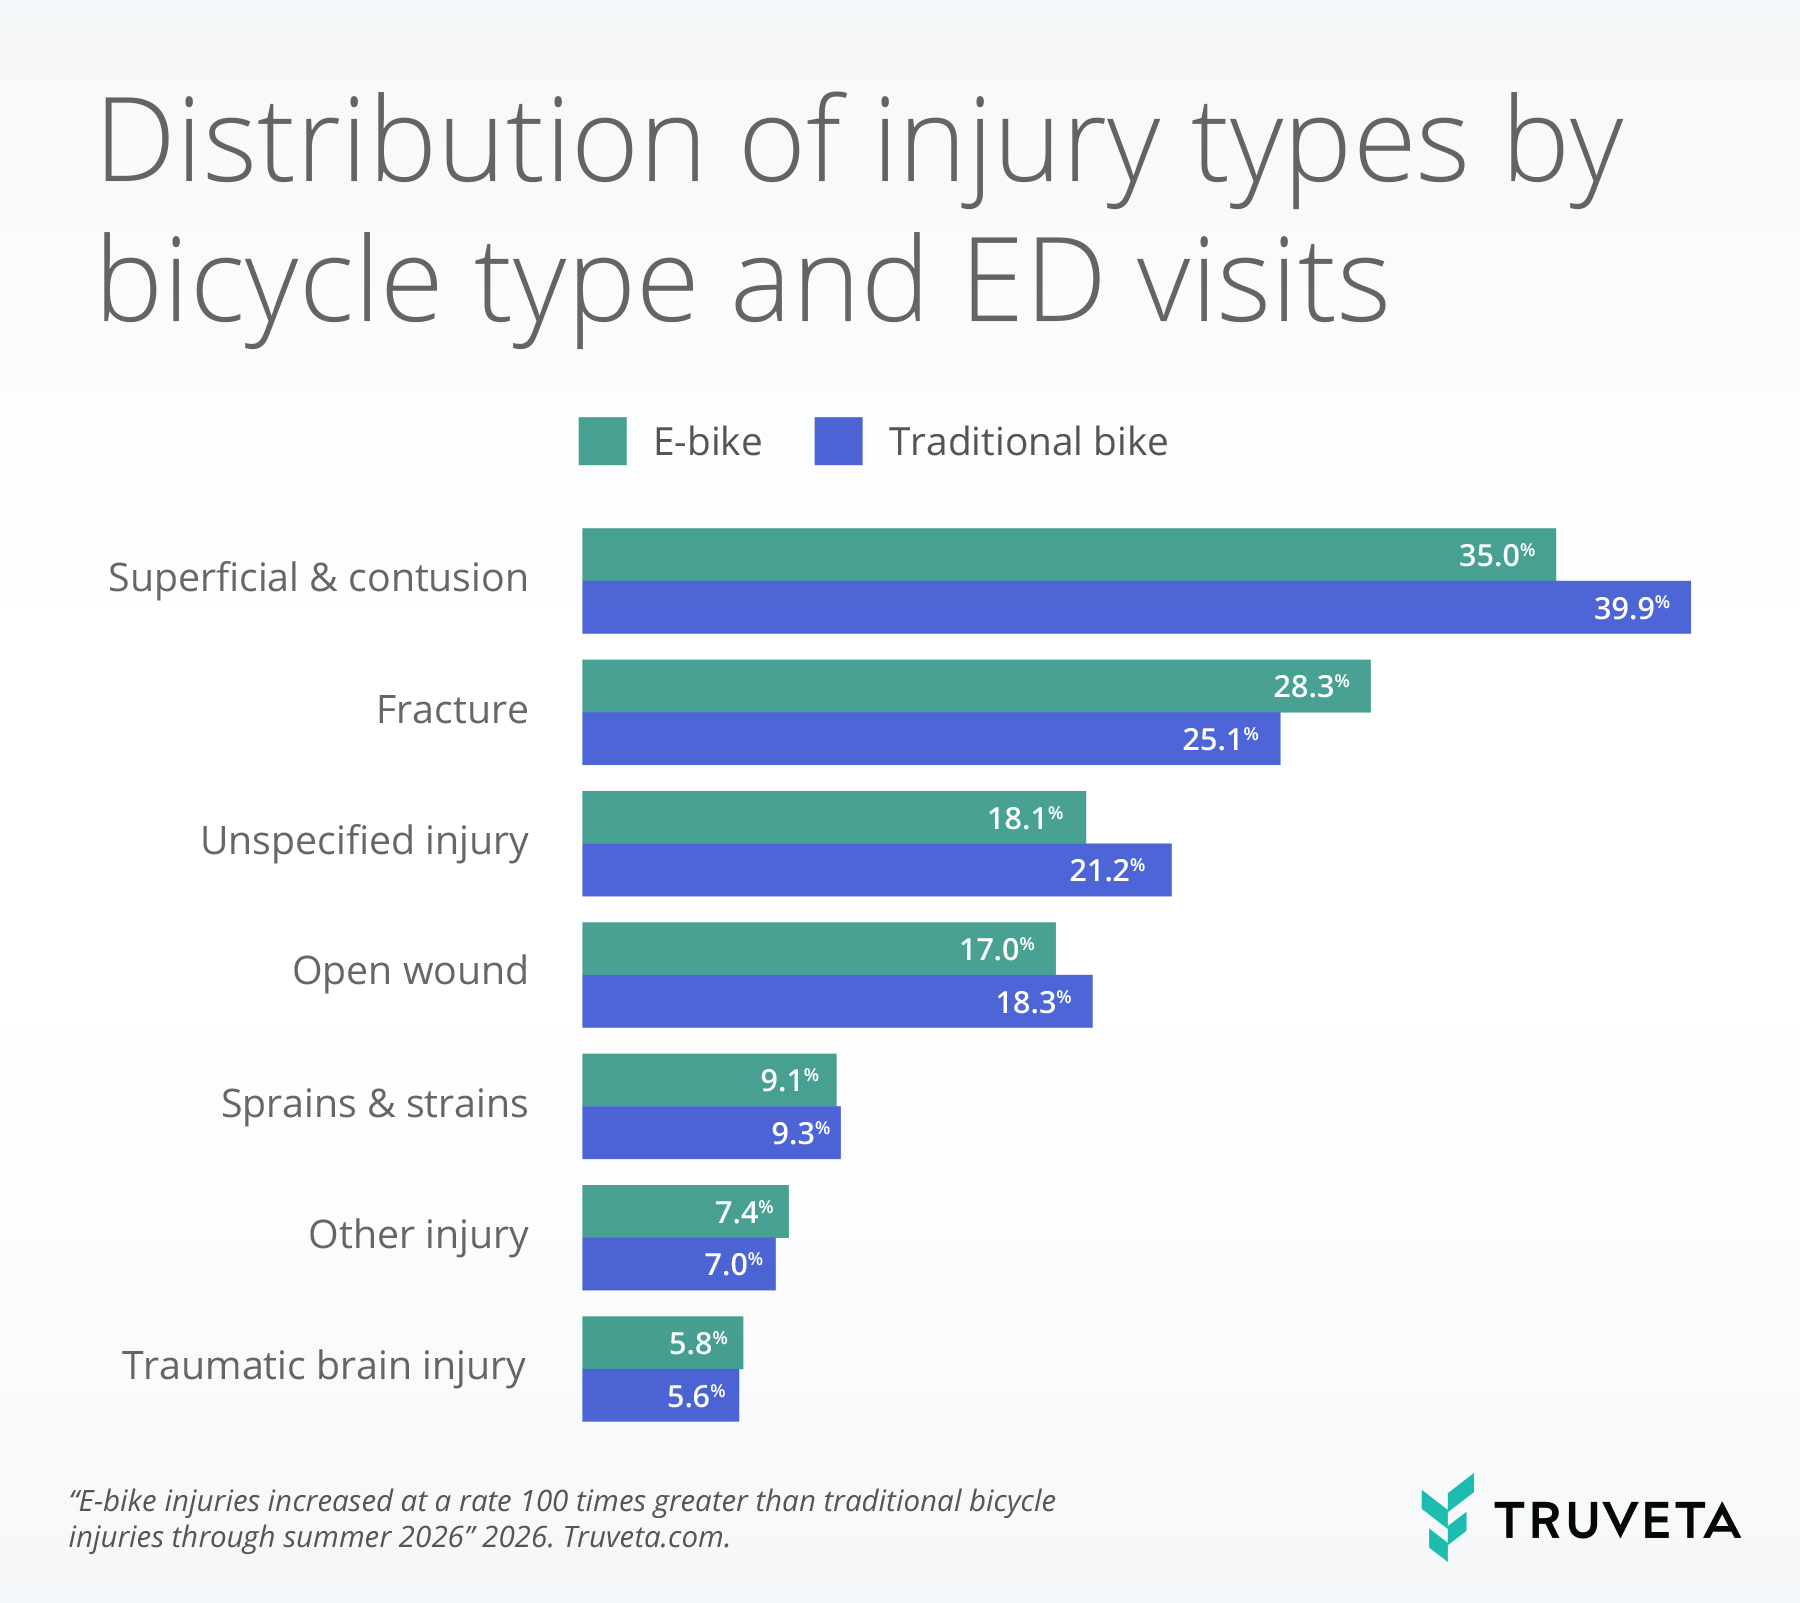
Injury patterns were broadly similar between e-bike and traditional bicycle injuries. For injuries where the type could be specified, superficial injuries and contusions were the most frequently diagnosed injury type, occurring in 35.0% of e-bike injury visits and 39.9% of traditional bicycle injury visits. Fractures were the second most common diagnosis and were slightly more prevalent among e-bike injuries (28.3% vs. 25.1%). Rates of traumatic brain injury were comparable between groups (5.8% vs. 5.6%).
Traumatic brain injuries
Among patients younger than 18 years, traumatic brain injury was diagnosed in 7.8% of e-bike-related ED visits and 6.0% of traditional bicycle-related visits. Percentages were more similar among adults aged 18–24 years (5.4% vs. 5.7%) and 25–44 years (5.3% vs. 4.8%). Among adults aged 45–64 years and 65 years or older, traumatic brain injury was less common in e-bike visits than traditional bicycle visits (3.9% vs. 5.6% and 4.2% vs. 6.7%, respectively).
Discussion
In this follow-up analysis, we found that higher rates of ED visits for injuries involving traditional bicycles compared with e-bikes. However, we also found the rate of e-bike-related ED visit rates rose 8.4-fold from 2023 to 2026, compared with only a 1.1-fold increase for traditional bicycles.
This pattern is consistent with recent national research showing that electric micromobility injuries are increasing much faster than traditional bicycle injuries (1, 2). Using US emergency department surveillance data, a previous analysis found that e-bike injury visit counts increased 389% from 2020 to 2024, compared with 6.4% for bicycles (2). Our analysis extends those findings through August 2026 and shows that the difference in growth persisted, with the e-bike visit rate increasing 760.2% compared with 7.9% for traditional bicycles.
ED visits associated with e-bikes increased across every age group, but the increase was most pronounced among children and adolescents under 18 years, whose rate rose approximately 19.1-fold, compared with a 1.5-fold increase for traditional bicycles.
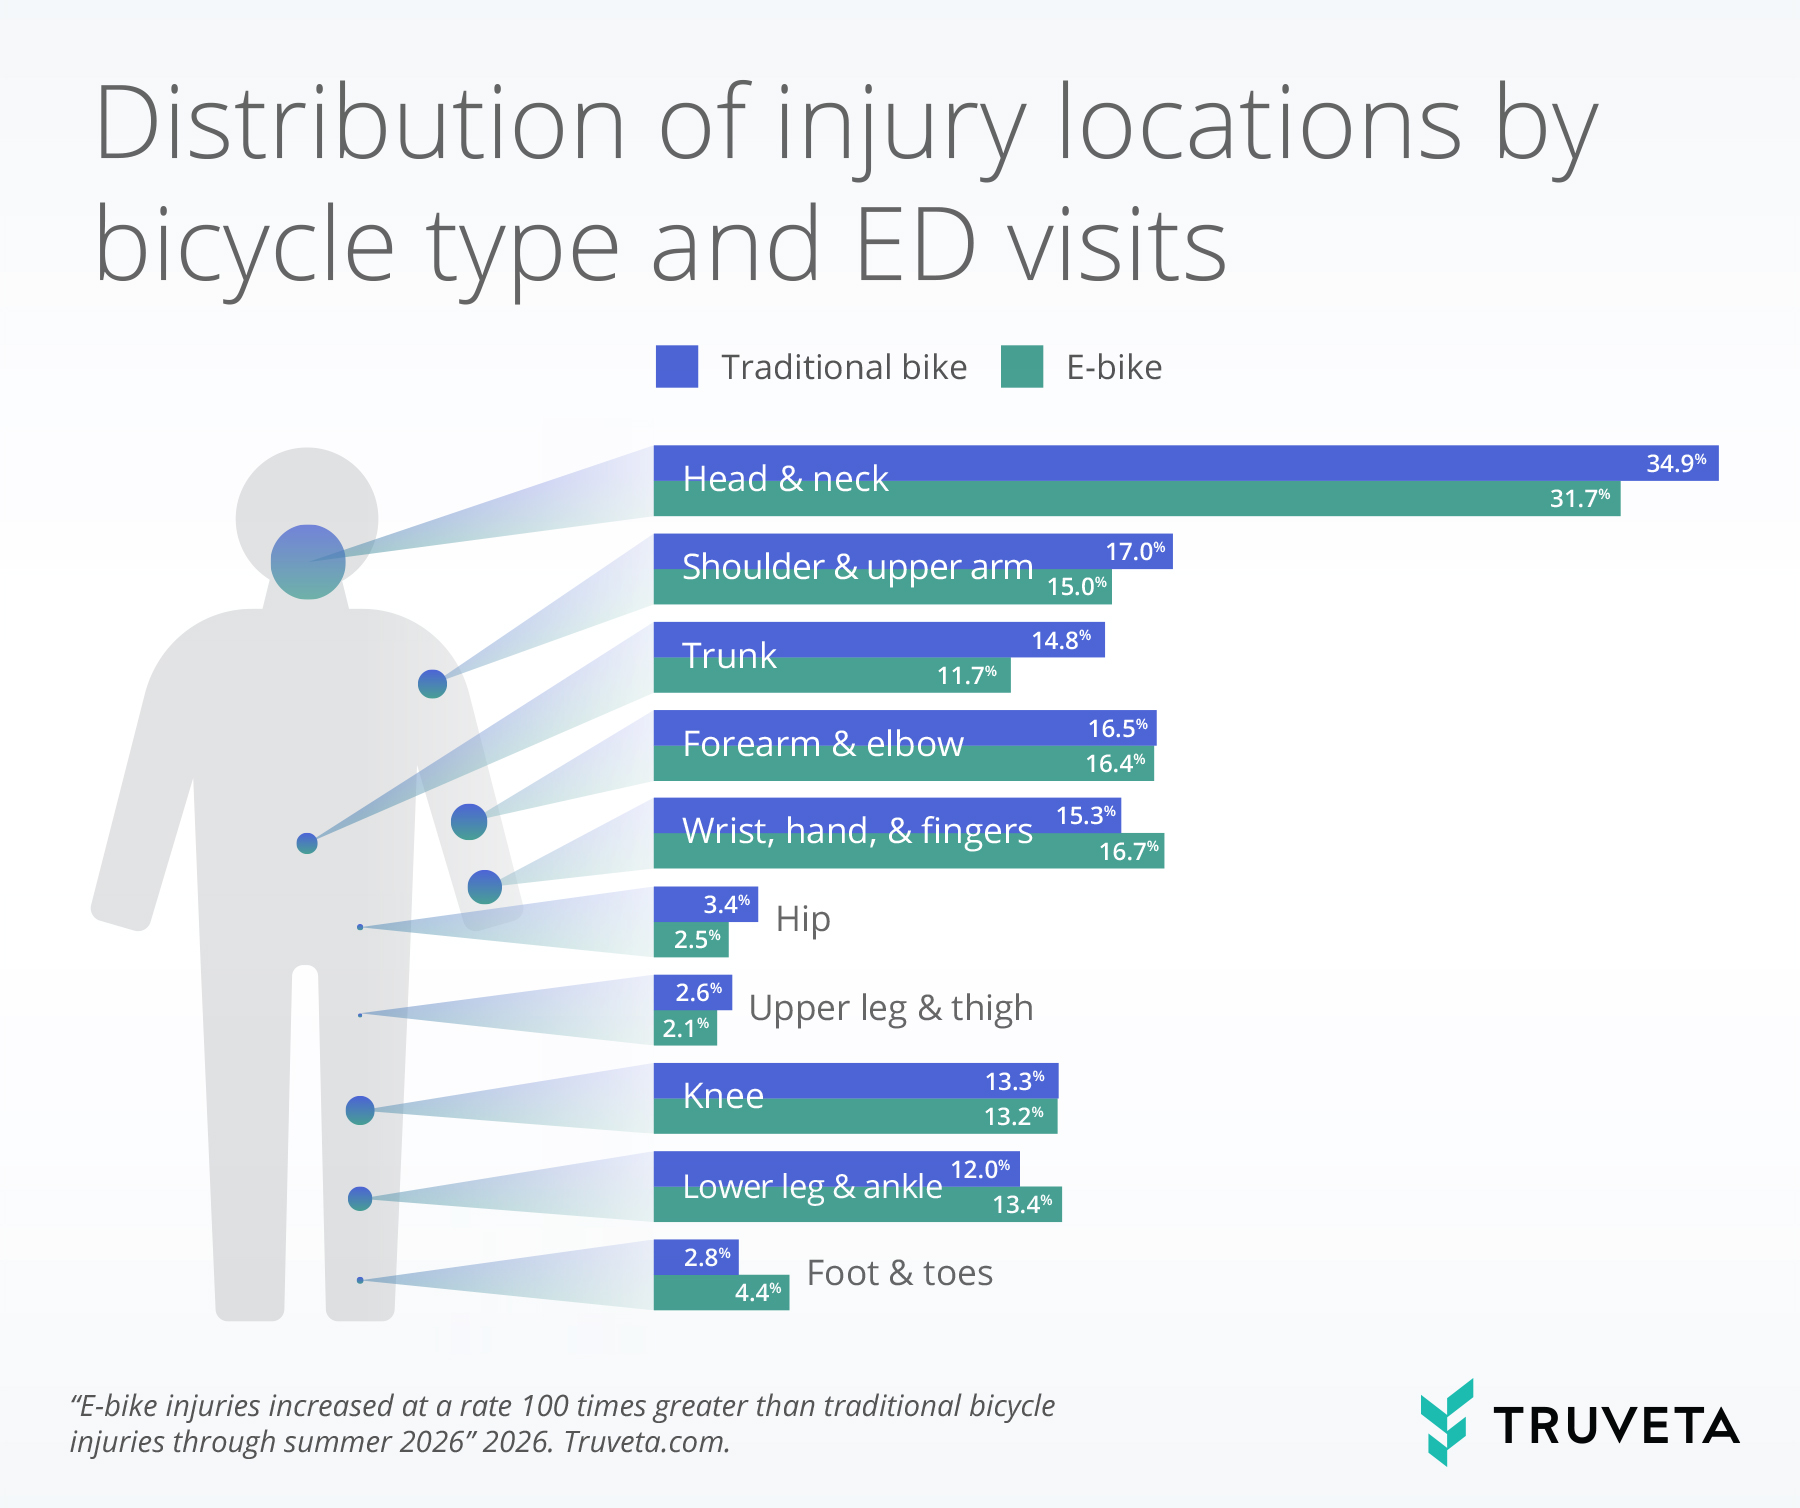
Our injury findings provide additional context on how e-bike and traditional bicycle visits compare. Injuries involving the head and neck were the most common injury location for both groups, accounting for nearly one-third of visits. Although head and neck injuries were less common among e-bike visits than traditional bicycle visits, traumatic brain injuries were more common among e-bike visits among patients younger than 18 years.
Several differences in injury patterns were also observed. Fractures represented a larger percentage of e-bike visits. E-bike visits were more likely to involve injuries to the wrist, hand, and fingers, lower leg and ankle, and foot and toes, whereas shoulder and upper arm and trunk injuries were more common among traditional bicycle visits. These findings suggest that while head injuries remain a major contributor to both e-bike- and bicycle-related ED visits, injury patterns may differ in important ways between the two bicycle types. These results are consistent with prior studies describing fractures as a substantial component of e-bike injuries (8, 9).
One national analysis estimated that e-bike-related fractures increased sharply from 2019 to 2023 and found that the wrist was the most common fracture location among riders younger than 18 years (8).
Unlike traditional bicycles, e-bikes are often subject to additional regulations, including age restrictions and helmet requirements. For example, many states prohibit riders younger than 16 years from operating Class 3 e-bikes, which can provide assistance up to 28 mph, and some states require helmets for younger riders or all Class 3 riders (10). The American Academy of Pediatrics recommends that children younger than 16 years not operate e-bikes or e-scooters (11).
Given the frequency of fractures and traumatic brain injuries observed in this study, promoting helmet use, age-appropriate rider training, and safe riding practices may help reduce preventable injuries as e-bike use continues to grow (7).
This study has several limitations. First, the comparison between e-bike and traditional bicycle-related ED visits was descriptive and did not statistically adjust for differences between the groups. People who use e-bikes and traditional bicycles may differ in age, riding frequency, speed, helmet use, riding environment, crash circumstances, motor vehicle involvement, and other contributing health factors. Therefore, differences in injury rates and patterns cannot be attributed to bike type alone, and future analyses should account for these factors (12).
Second, increases in e-bike-related ED visit rates over time may reflect both an increase in injuries and improved documentation. ICD-10-CM external cause codes specific to e-bikes became available in October 2022, and coding completeness may have improved as clinicians became more familiar with these codes. Finally, the analysis included only injuries resulting in ED visits with diagnoses recorded on the same day and therefore represents injuries severe enough to seek emergency care. Less severe injuries treated in urgent care or outpatient settings, or managed at home, were not captured.
By tracking the rapid increase in e-bike-related ED visits compared with traditional bicycles and examining differences in associated injury patterns, this analysis provides timely evidence that may help inform injury-prevention efforts. Continued monitoring of e-bike injury trends and associated injuries will be important as e-bike use continues to increase, and rider populations continue to evolve.
These are preliminary research findings and not peer reviewed. Data are regularly updating. These findings are consistent with data accessed on September 17, 2026.
Citations
1. J. Austin, L. Perkins, L. N. Haines, L. Kobayashi, A. E. Berndtson, J. L. Weaver, J. Santorelli, J. Maa, R. C. Ignacio, S. Burruss, An exponential increase in e-bike injuries in California. Trauma Surgery & Acute Care Open 11, e002099 (2026).
2. B. Singichetti, E. W. Lundstrom, A. C. Schumacher, V. Barry, Characterisation of e-scooter, e-bike and bicycle injuries by motor vehicle involvement: USA (2020–2024). Injury Prevention, doi: 10.1136/ip-2026-046214 (2026).
3. A. Anderson, M. McLellan, A. Tedesco, K. Callan, C. Grabar, V. Joe, J. Nahmias, J. Learned, Comparison of Characteristics, Injury Patterns, and Orthopaedic Injuries Between Electric Bicycle, Pedal Bicycle, Electric Scooters, and Motorcycle Accidents at a Level 1 Trauma Center. J Am Acad Orthop Surg Glob Res Rev 9, e25.00099 (2025).
4. T. Berk, S. Halvachizadeh, J. Backup, Y. Kalbas, T. Rauer, R. Zettl, H.-C. Pape, F. Hess, J. E. Welter, Increased injury severity and hospitalization rates following crashes with e-bikes versus conventional bicycles: an observational cohort study from a regional level II trauma center in Switzerland. Patient Saf Surg 16, 11 (2022).
5. E. Spörri, S. Halvachizadeh, J. G. Gamble, T. Berk, F. Allemann, H.-C. Pape, T. Rauer, Comparison of Injury Patterns between Electric Bicycle, Bicycle and Motorcycle Accidents. Journal of Clinical Medicine 10 (2021).
6. D. D. Özman, S. M. I. Roth, M. G. Fois, L. Diehr, M. P. J. Teuben, H. Zhang, M. Praster, T. Berk, F. Hildebrand, R. V. M. Groven, Increased injury severity and age-related mortality in trauma victims after e-bike versus conventional bicycle accidents: a concerning call to action! Patient Saf Surg 20, 25 (2026).
7. G. Pitcher, M. Mendoza, A. McCague, A. Henken-Siefken, The Impact of Helmet Use on Injury Severity and Clinical Outcomes in E-Bike Riders. Cureus 17, e85153.
8. N. K. Namiri, A. R. Locke, N. H. Koehne, A. Yendluri, K. K. Obana, K. Nietsch, J. Yu, J. J. Corvi, J. Song, J. Podolnick, The rapid escalation of fractures and hospital admissions from electric bicycle injuries in the United States: an analysis of national injury data from 2019 to 2023. Journal of Orthopaedic Trauma 39, 269–274 (2025).
9. Z. Wang, K. Zhao, J. Zheng, C. Chen, G. Zhang, X. Chen, Electric bicycles-related orthopedic injury spectrum: retrospective analysis of 1,735 cases (2020–2025). J Orthop Surg Res 21, 484 (2026).
10. U.S. Electric Bike Laws 2026: State-by-State Guide, Velotric (2026). https://www.velotricbike.com/blogs/story-landing/electric-bike-laws-by-state.
11. S. Schering, S. Writer, How to advise parents who ask if children should ride electric bikes. (2026).
12. D. Bauer, J. P. Maier, L. Holzfurtner, C. Pietsch, F. C. Wagner, H. Schmal, B. Erdle, N. Mühlenfeld, Electric bicycle versus conventional bicycle crashes: comparative analysis of injury patterns, severity, and the modifying effect of body mass index. Eur J Trauma Emerg Surg 52, 250 (2026).